Once the case, grains and nozzle are defined, one click runs an internal-ballistics simulation in the design workspace. The propellant surface regresses through the grain geometry, chamber pressure follows from the burn-rate law, and the nozzle model produces the thrust curve.
Run and read the simulation#
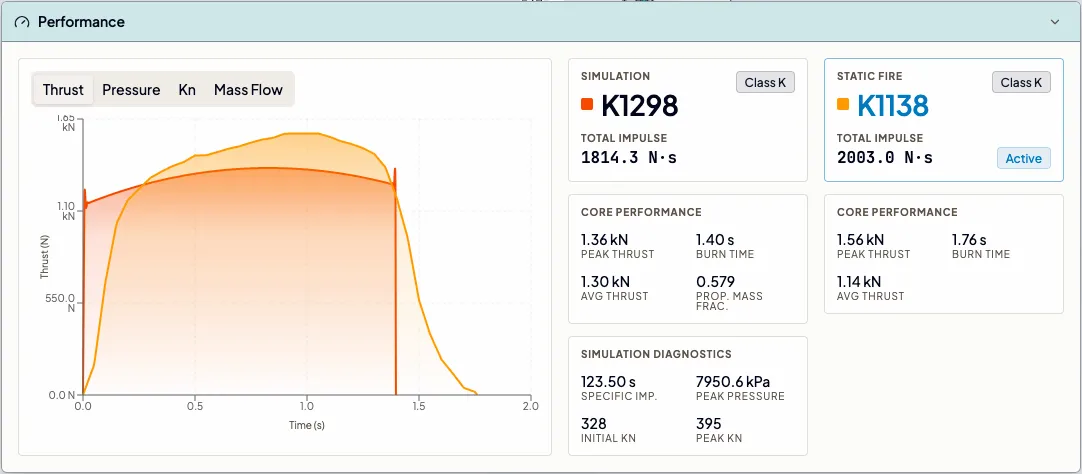
The performance panel summarizes both motor output and internal ballistics. It shows the standard letter-plus-average-thrust designation, total impulse, peak and average thrust, burn time, propellant mass fraction and specific impulse. Peak chamber pressure and initial and peak Kn describe what is happening inside the motor during the burn.
Four chart tabs trace the burn over time:
- Thrust
Thrust over time. Imported static-fire data also appears here, so you can compare the measured and simulated curves.
- Pressure
Chamber pressure over time. Use it to check case loading and whether the burn remains within the propellant's characterized pressure range.
- Kn
Kn is the burning propellant surface area divided by the nozzle throat area. The chart shows how that ratio changes as the grains regress.
- Mass flow
Flow through the nozzle over the burn, in kg/s.
Design issues#
The motor editor reports two kinds of design issues in the status button. Geometry checks update as you edit and catch dimensions that do not fit, such as an oversized core or a grain stack longer than the case. Ballistic checks run with the simulation and flag conditions such as a low port-to-throat ratio, excessive mass flux, supersonic core flow or chamber pressure outside the propellant's characterized range. Each issue includes its severity, the reason it was raised and possible mitigations.
Results also track the design: edit the motor after a run and the performance panel flags Outdated Results until you re-simulate.
Compare with static-fire data#
Import a measured thrust trace and it overlays the simulation in the thrust chart. A motor can also switch to the measured curve as its performance source, so your rockets fly with the tested data. Static Fire Data covers the import flow and what switching over means.