A finished run opens in four tabs — 3D View, Charts, Events and Environment — each a different view of the same flight.
3D View#
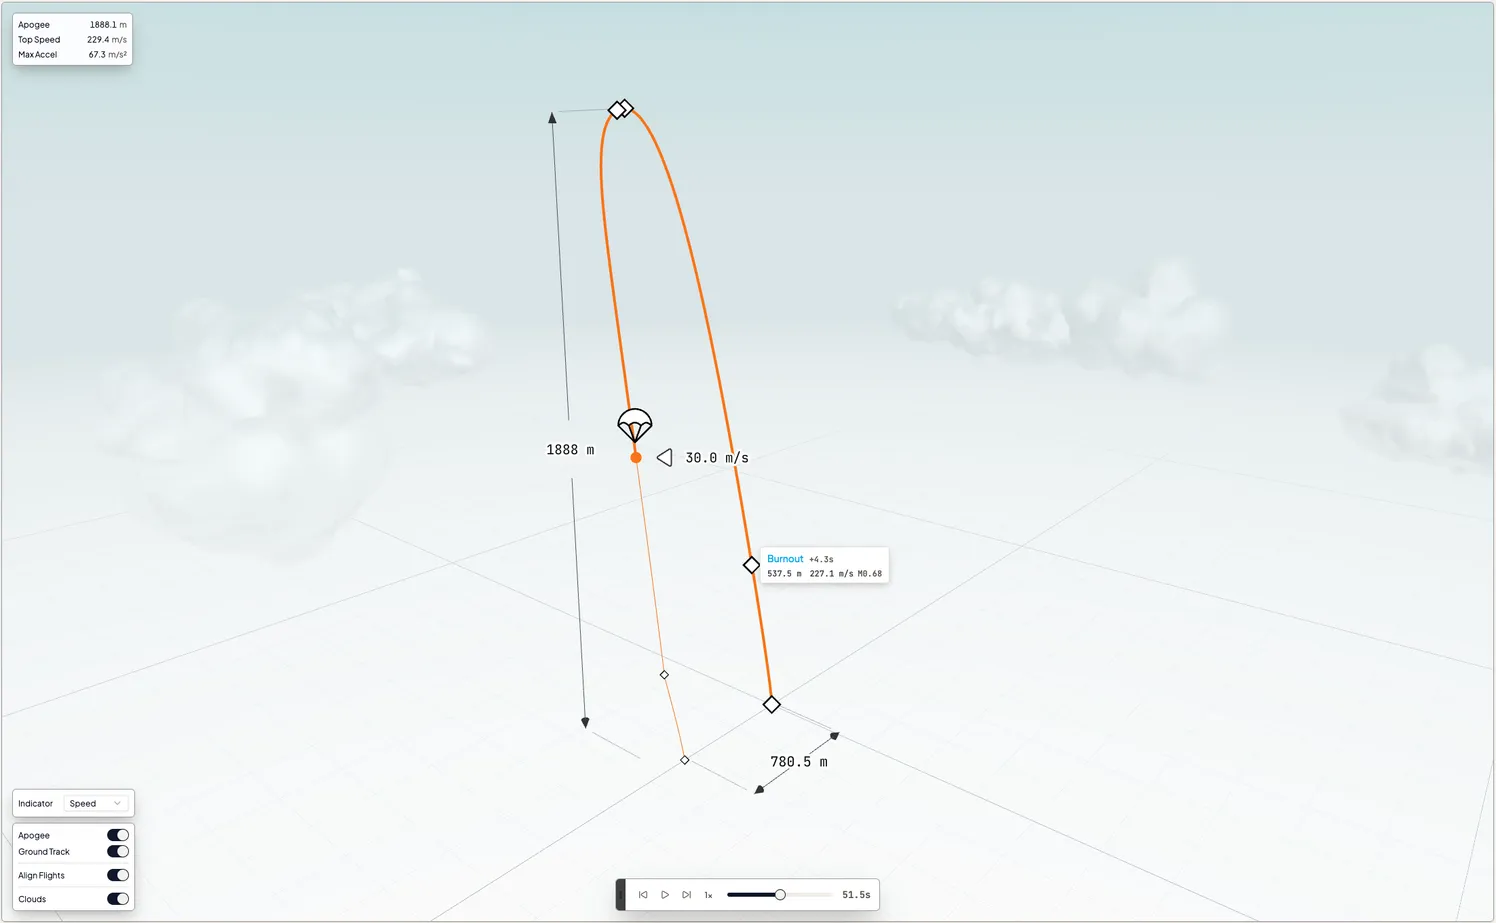
The 3D view plays the flight back over the launch site: scrub the timeline, run it from quarter speed to 4×, and orbit the trajectory as it unfolds. Display toggles add an apogee marker, project the ground track to show drift, and pin a live speed or altitude readout to the rocket as it flies. The projected ground track makes horizontal drift easy to see during playback.
The Map toggle drapes Satellite or Street imagery of the launch site under the flight, with the trajectory's shadow cast onto it, so drift reads against real terrain. The choice is remembered in your browser.
Charts#
The summary card leads the tab: apogee, top speed with Mach number, and maximum acceleration, each with its time, alongside flight, burn and coast duration, total impulse, initial propellant mass and landing velocity.
Below it, the charts cover altitude, angle of attack, path angle, thrust, drag, lift and stability margin. Velocity and Mach share a dual-axis chart; acceleration, angular velocity and angular acceleration are grouped by their three axes.
With a linear time axis, a long descent can compress boost, burnout and deployment into a small part of each chart. Adaptive time gives more horizontal space to periods where the data changes quickly while still showing the complete simulation. Zooming any chart updates the time range on all of them.
Events#
The event view timestamps liftoff, rail departure, motor burnout, apogee, parachute deployments and landing, stage by stage. A stage with several motors lists each burnout and airstart ignition by motor name. Rail departure includes velocity, stability, angle of attack and thrust-to-weight; landing includes touchdown velocity. Multi-stage flights add separation and upper-stage ignition for each stage. Relevant events also appear on the charts, keeping the timeline and traces aligned.
Environment#
The environment view shows the atmosphere the run used: surface conditions at the pad — elevation, pressure, temperature, speed of sound, wind speed and direction — plus profiles of wind speed, wind direction, pressure and temperature against altitude. When a live forecast was used, this tab shows the atmospheric conditions and profiles used by the simulation.
Simulation results are purely educational. See Safety.